Release Notes
Components
Guidelines
Patterns
Words
Resources
Modules Overview
/
Design
Dynamically load data and video in a modular layout.
The module system acts as an interface shell for Hudl's new experiences. Is a collection of components that enables users to filter complex data and video in a variety of contexts. It displays the experience's positioning based on the user's preference from a set of predetermined layouts with common interaction patterns between experiences.
Hierarchy

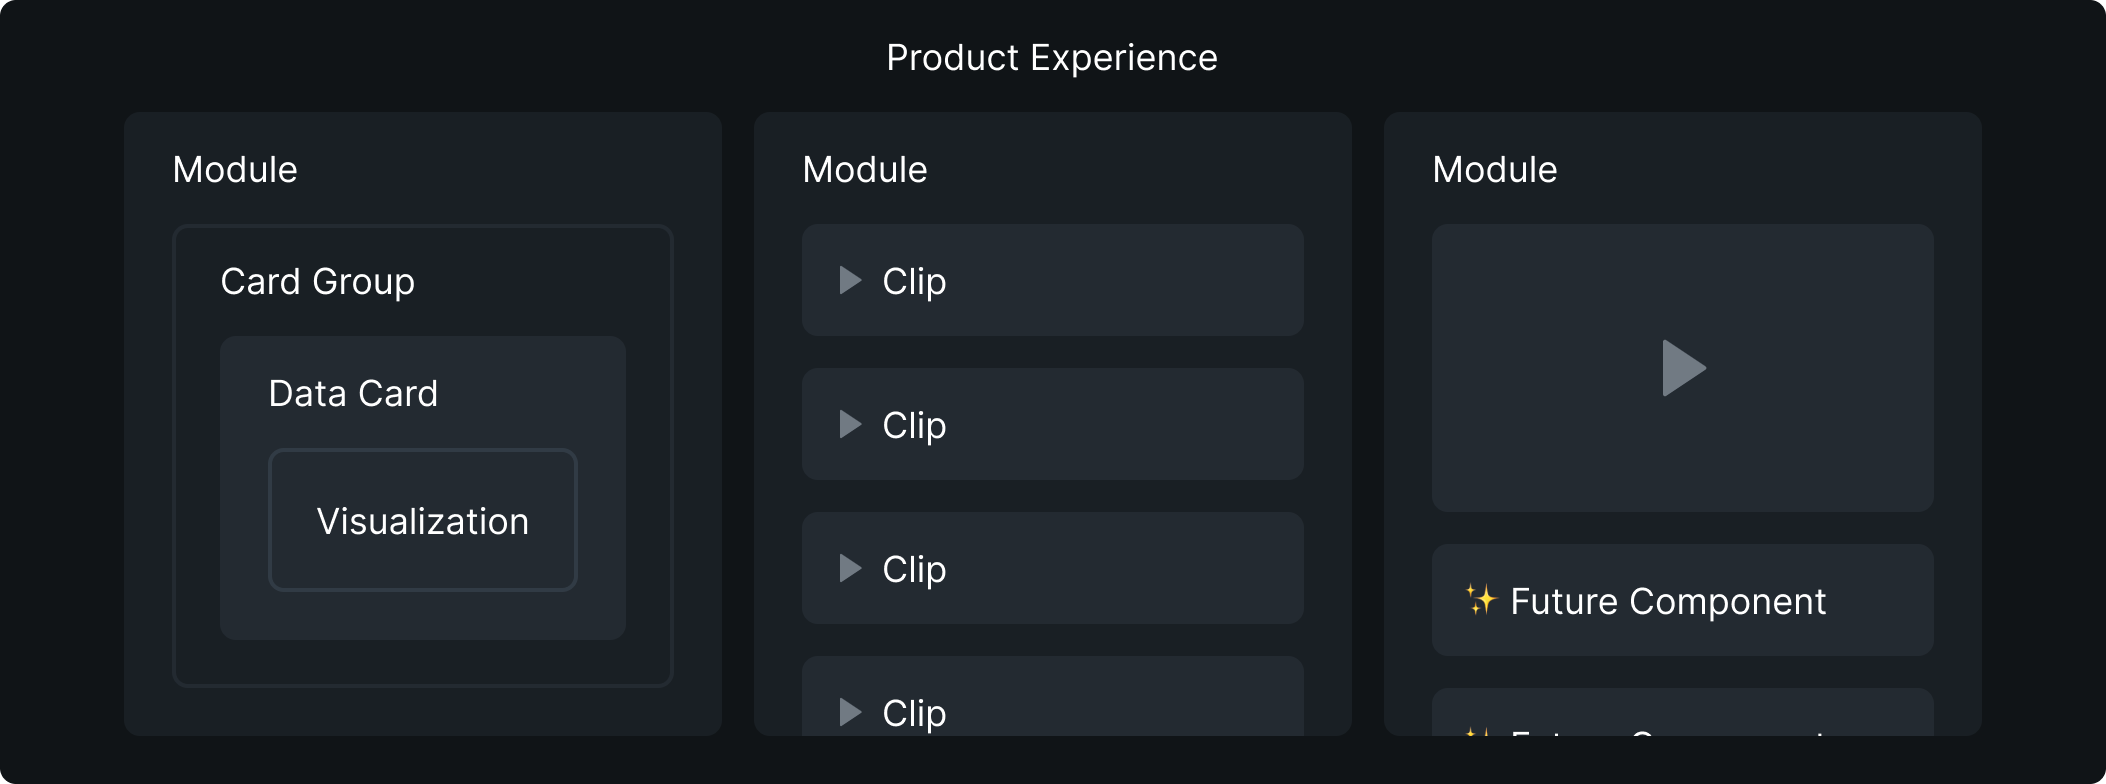
The module system is the foundation of Hudl's newest experiences. It is what constrains the context and orients our user in the interface. The system consists of several layers. It relies on strong parent-child relationships to maintain our user's expected experience. These layers support one-to-many relationships. Put simply, parent data can reference and manipulate many child records in another data set. For example, if a football user wants to filter between ODK values, the data within Situations, Formations and other data sets will change based on their selection.
The product experience is the viewport within the browser window or app screen.
A module makes up the outermost layer of the layout system. They are the parent of other components specific to the module system. Current Uniform components support tight relationships between data and video, but in the future they will support things like clip lists, conversations, navigation and more. They also handle arranging the components within them responsively.
A card group acts as the container for a subset of data. They are the parent of data-specific components within the module system. They enable many, related data sets to display and manipulate them at once.
A data card displays the data for a single subject and is the parent to many types of data visualizations. They allow for static or dynamic content within the same category.
Visualizations are the specific module system components used to represent data graphically. They communicate data in many ways. They allow filtering of data within the product experience based on the user's preferred context.
Choosing a Visualization
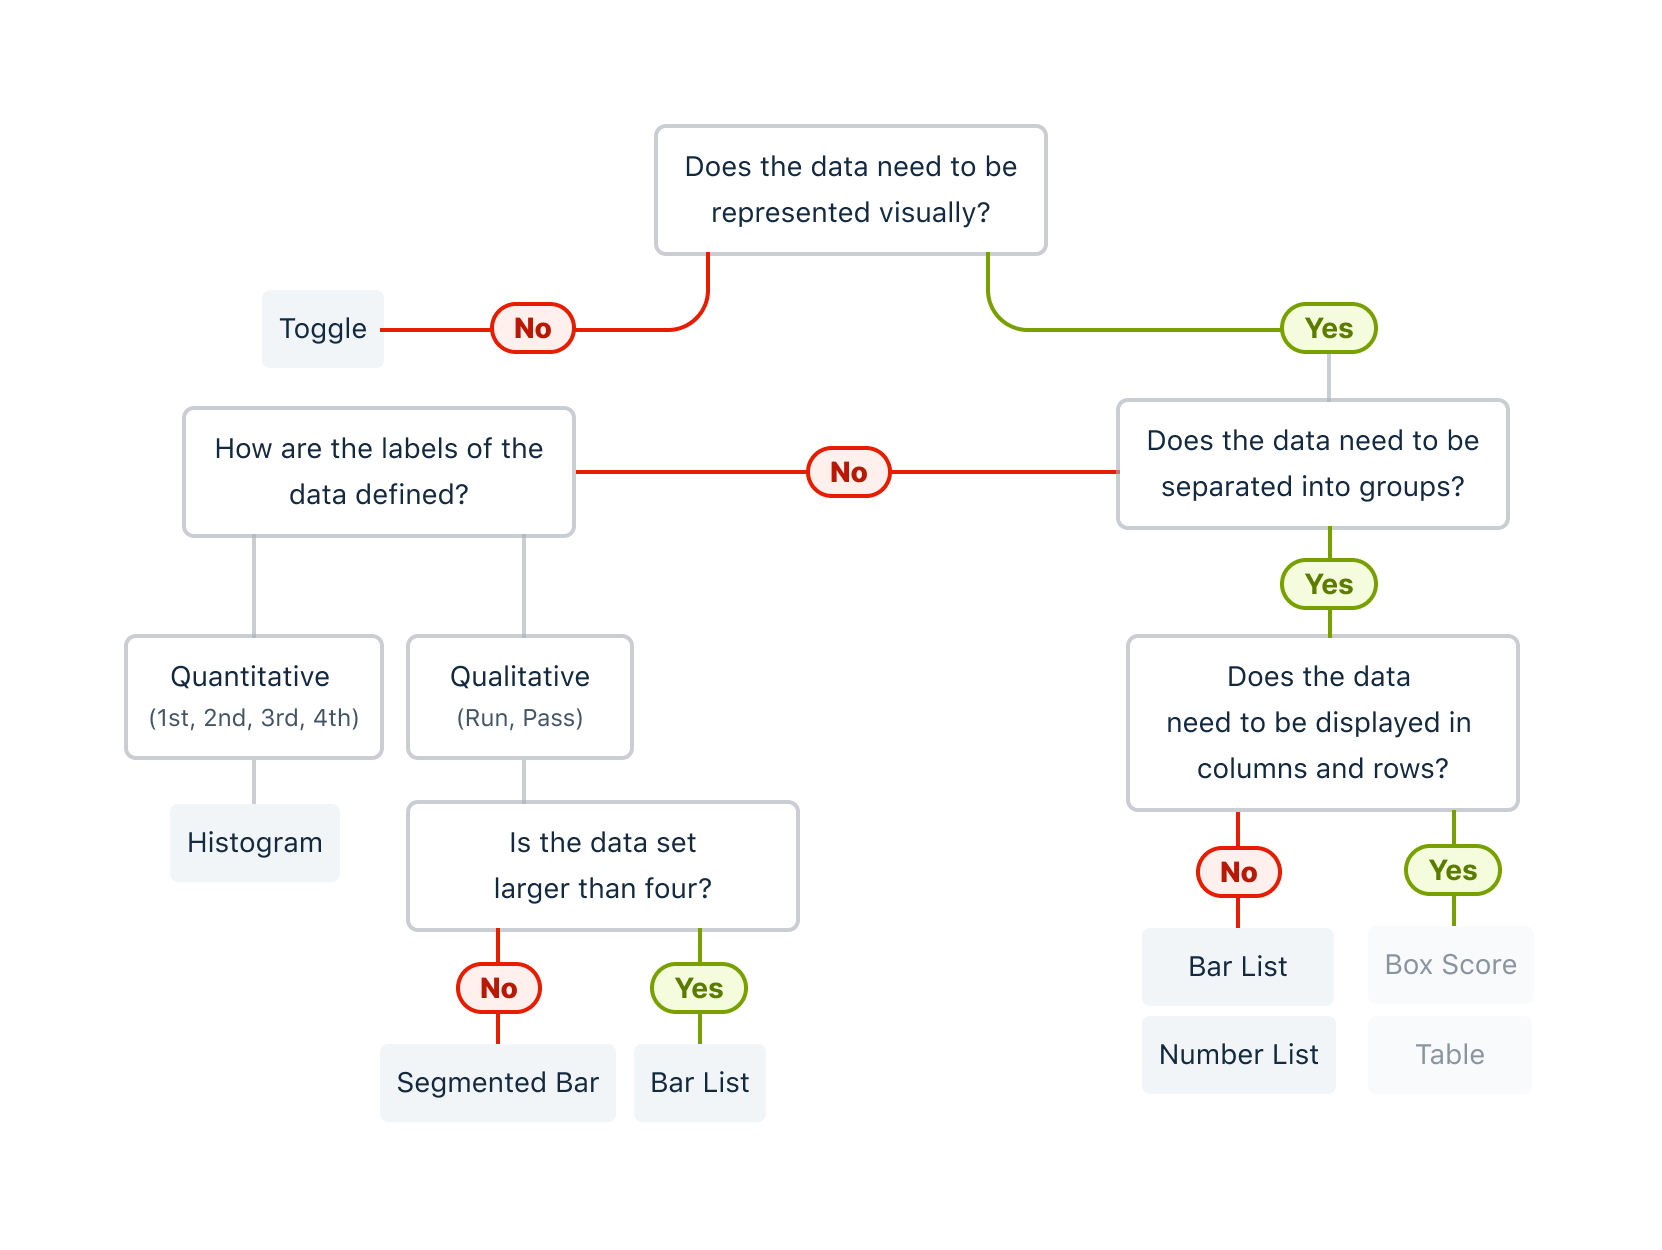
All types of data can display in various ways. Some are more common because they are easier to digest and understand. Choose others because they're faster to build and manipulate. Data sets vary between sports, type, context and more. Rather than firm recommendations, we propose a set of possible options.
There are so many different ways to visualize data. What's most important is asking ourselves how do the parts of the data relate? Is the data based on a common element like time or category, or might it be a correlation or comparison?
To simplify the data landscape, we've derived a decision tree that aims to help you tell a convincing story. This acts as a guide, not a rule so as always test with our users to see which they identify with most.

Filtering and Manipulating Data
Some data sets don't need to be displayed as a larger visualization. In some cases the data set acts as a filter to manipulate downstream data. To ensure our users to feel in control of their data, we must find simple ways to drill down to what matters most to them.